Our Sustainability actions are guided by what matters most
At the core of our Sustainability approach is the purpose of BW LPG – Delivering energy for a better world.
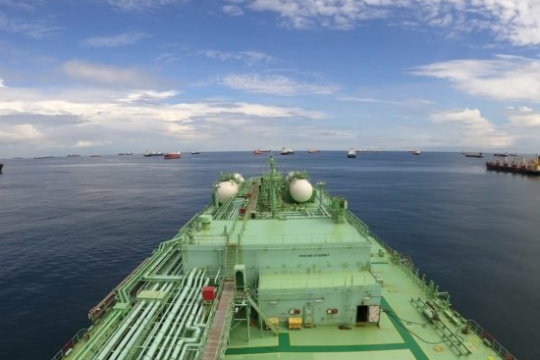
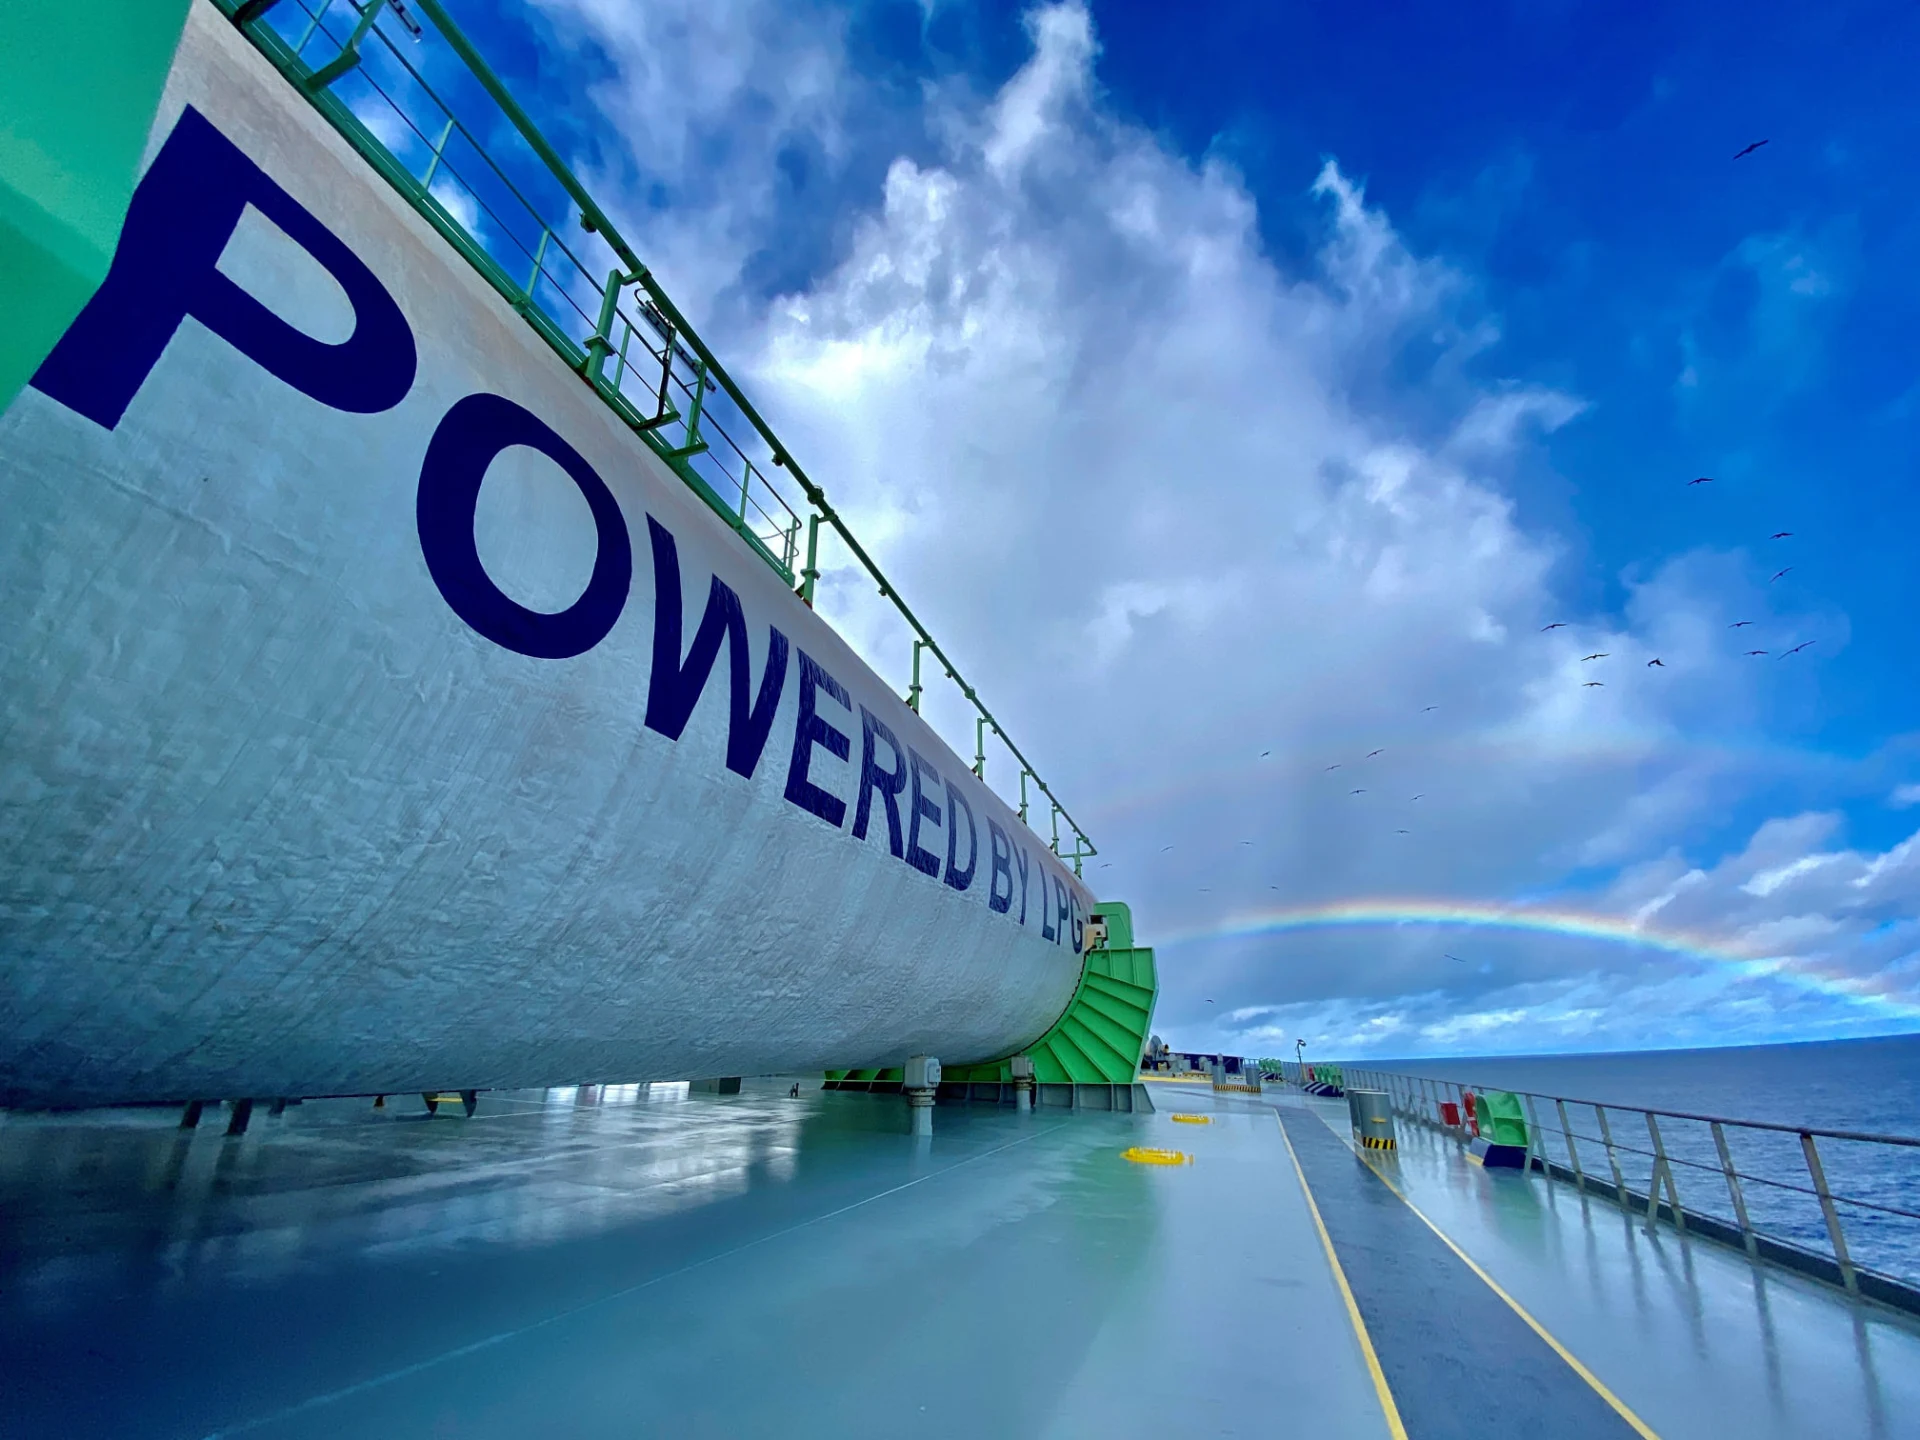
We are supporting the world’s transition towards cleaner energy, creating value for society and being a reliable partner for our stakeholders.
Sustainability strategy
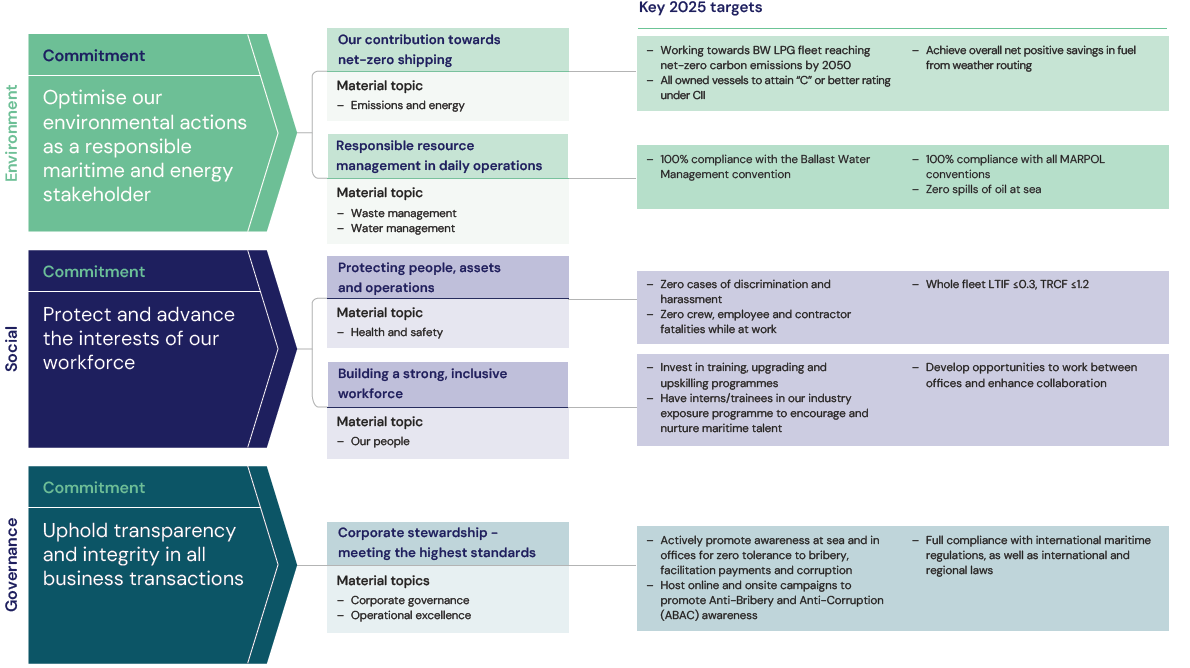
Our ESG and overall business strategy is centred around creating shared value, aligned with the United Nations Sustainability Development Goals (UN SDGs) through our material topics.
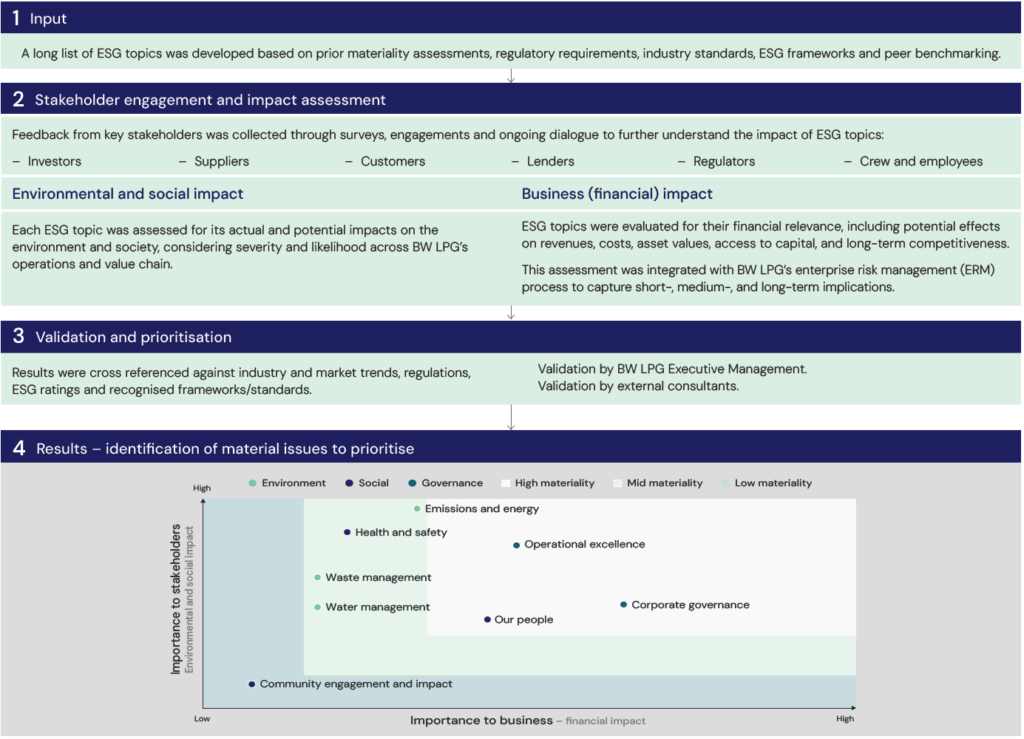
Double Materiality Assessment (DMA) – for sustainable value creation
We conduct periodic materiality assessments to identify and prioritise the issues that are most relevant to our business, our stakeholders and the societies in which we operate. Ensuring our sustainability priorities are closely aligned with our corporate strategy, enterprise risk management and long-term value creation, our assessment applies a double materiality approach (DMA). This would be done by evaluating both BW LPG’s impacts on the environment and society as well as the financial risks and opportunities that may affect business performance.
Material topics
Emissions and energy
Manage energy efficiency and fuel consumption, greenhouse gas and toxic emissions.
Waste management
Reduce, reuse and responsibly dispose of waste to minimise environmental impact
Water management
Sustainable use and preservation of water resources
Health and safety
Health, safety and welfare assurance for onshore staff, crew and contractors
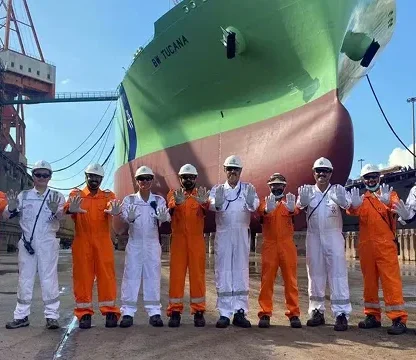
Our people
Provide growth opportunities, training and fair workplace packages
Corporate governance
High standards of reporting and governance structures.
Operational excellence
Continuous improvement in processes and systems to maximise efficiency, quality and organisational resilience
Stakeholder engagement – collaboration that drives impact
Stakeholder engagement is a core element of BW LPG’s sustainability and business strategy, helping us understand stakeholder priorities, identify ESG-related risks and opportunities, and support long-term value creation.
Stakeholder input informs our double materiality assessment, strategic priorities, target setting and disclosures. We exchange regularly with key stakeholder groups and collaborate across our value chain through structured engagements and ongoing dialogue.
Stakeholder feedback is reviewed by relevant business functions and management and integrated into operational decision-making, enterprise risk management and sustainability initiatives.
Emissions and energy
Manage energy efficiency and fuel consumption, greenhouse gas and toxic emissions.
Waste management
Reduce, reuse and responsibly dispose of waste to minimise environmental impact
Water management
Sustainable use and preservation of water resources
Health and safety
Health, safety and welfare assurance for onshore staff, crew and contractors
Our people
Provide growth opportunities, training and fair workplace packages
Corporate governance
High standards of reporting and governance structures
Operational excellence
Continuous improvement in processes and systems to maximise efficiency, quality and organisational resilience
Stakeholder engagement – collaboration that drives impact
Stakeholder engagement is a core element of BW LPG’s sustainability and business strategy, helping us understand stakeholder priorities, identify ESG-related risks and opportunities, and support long-term value creation.
Stakeholder input informs our double materiality assessment, strategic priorities, target setting and disclosures. We exchange regularly with key stakeholder groups and collaborate across our value chain through structured engagements and ongoing dialogue.
Stakeholder feedback is reviewed by relevant business functions and management and integrated into operational decision-making, enterprise risk management and sustainability initiatives.